Develop Japan Financial & Stock app with GCP Free Tier Part3
#JAはじめに
Always Freeプロダクト枠を使用し、決算書による財務分析&株価分析Webアプリを作ってみる
第三弾。
今回は財務情報をCloud Storageに格納し、チャートや表で表示する部分の実装をしてみます。
決算書
今回表示するのは企業の財務情報ということで、決算書を使用します。
なお決算書には下記二種類が存在します。
速報として決算短信(投資家向けのIRやTDnetから閲覧可能)、
確報として有価証券報告書(金融庁が運営するedinetから閲覧可能)で入手可能
今回はedinet経由で取得できる有価証券報告書のデータを使用します。
決算書は主に下記の3つのパートからなり、このことから財務三表ともいいます。
これらの表から、企業の収益性、安全性、成長性を把握することができます。
1. 損益計算書(P/L) : 人でいうと運動成績表
利益のために会社がどれだけ動いて動きに無駄がないかといったことも読み取れる
売上(運動量) - 費用(動き) = 利益(進んだ距離・成果)
2. 貸借対照表(B/L) : 人でいうと健康診断表
財産(現金や原材料、土地、建物などの資産額)と元手(銀行からの入借金や資本金など)が記されている
資産(体つき) = 負債(体を支える借り物の骨格) + 純資産(体を支える自分の骨格)
3. キャッシュフロー計算書(C/S) : 人でいうと血流検査表
現金の出入りを営業(商品やサービスを仕入れたり売ったりした活動)、
投資(工場や設備の拡大や縮小にかかる活動)、財務(銀行にお金を借りたり返したり)の3つの活動に分けて把握
まずはLocalで
いきなりGCPを使う前にまずはローカルでということであらかじめ下記決算情報が書かれた
index/edinet code/決算日
P/L : /売上高/売上原価/売上総利益/販管費/営業利益/営業外収益/営業外費用/経常利益/特別利益/特別損失/税引前当期純利益/法人税等/当期純利益
B/S : 流動資産/固定資産/有形固定資産/無形固定資産/投資その他の資産/流動負債/固定負債/純資産
C/S : 営業活動によるキャッシュ・フロー/投資活動によるキャッシュ・フロー/財務活動によるキャッシュ・フロー
csv形式のファイルを使用します。
0,E00012,1301,2015-03-31,218350000000.0,198009000000.0,20341000000.0,17881000000.0,2460000000.0,674000000.0,1026000000.0,2107000000.0,3644000000.0,983000000.0,4769000000.0,2389000000.0,,69860000000.0,19076000000.0,12241000000.0,465000000.0,6369000000.0,46460000000.0,19406000000.0,23069000000.0,-2340000000.0,-762000000.0,3698000000.0
1,E00012,1301,2016-03-31,226626000000.0,205854000000.0,20771000000.0,18337000000.0,2433000000.0,698000000.0,317000000.0,2814000000.0,428000000.0,681000000.0,2561000000.0,804000000.0,1756000000.0,70426000000.0,24181000000.0,16972000000.0,907000000.0,6301000000.0,40835000000.0,30707000000.0,23065000000.0,2689000000.0,-5114000000.0,2482000000.0
2,E00012,1301,2017-03-31,236561000000.0,213292000000.0,23268000000.0,19544000000.0,3723000000.0,764000000.0,779000000.0,3709000000.0,651000000.0,458000000.0,3902000000.0,1518000000.0,2384000000.0,72351000000.0,25040000000.0,17137000000.0,496000000.0,7407000000.0,45195000000.0,26804000000.0,25391000000.0,601000000.0,-1998000000.0,105000000.0
3,E00012,1301,2018-03-31,254783000000.0,231180000000.0,23603000000.0,19536000000.0,4066000000.0,809000000.0,438000000.0,4437000000.0,1576000000.0,1461000000.0,4552000000.0,1416000000.0,3136000000.0,82389000000.0,23916000000.0,15377000000.0,497000000.0,8040000000.0,52100000000.0,24962000000.0,29243000000.0,3201000000.0,-1179000000.0,255000000.0
4,E00012,1301,2019-03-31,256151000000.0,232446000000.0,23705000000.0,19873000000.0,3831000000.0,1123000000.0,520000000.0,4434000000.0,125000000.0,570000000.0,3989000000.0,1242000000.0,2746000000.0,89425000000.0,25248000000.0,14981000000.0,549000000.0,9717000000.0,54730000000.0,27946000000.0,31996000000.0,-4118000000.0,-2494000000.0,5958000000.0
5,E00012,1301,2020-03-31,262519000000.0,238274000000.0,24245000000.0,21326000000.0,2918000000.0,1208000000.0,518000000.0,3608000000.0,68000000.0,664000000.0,3012000000.0,1336000000.0,1675000000.0,85251000000.0,25932000000.0,15976000000.0,541000000.0,9414000000.0,54818000000.0,23773000000.0,32593000000.0,9410000000.0,-2931000000.0,-4817000000.0
今回言語はPython、フレームワークはFlaskで構築してみます。
ローカルでサーバをたてて、csv形式の財務データを読み込み、チャートや表で表示します。
ということで下記モジュールをインストールします
pip3 install Flaskサーバ起動およびエントリーポイントは下記。
/company/codeのcode部分で銘柄コードを指定し、該当codeの財務情報を出力します。
ただしデータの中には粗利率や利益率などの情報は含まれていないので、バックエンドで計算し、フロントに渡します。
from flask import Flask, jsonify, abort, make_response, request
app = Flask(__name__)
@app.route('/company/<code>')
def get_finance(code):
# for local
csv='finance/'+str(code)+'.csv'
all_financeinfo = pd.read_csv(csv,header=None)
all_financeinfo.loc[:,4:27] /= 1000000
all_financeinfo.loc[:,28] = (all_financeinfo.loc[:,6] / all_financeinfo.loc[:,4]) * 100
all_financeinfo.loc[:,29] = (all_financeinfo.loc[:,8] / all_financeinfo.loc[:,4]) * 100
all_financeinfo.loc[:,30] = (all_financeinfo.loc[:,11] / all_financeinfo.loc[:,4]) * 100
all_financeinfo.loc[:,31] = (all_financeinfo.loc[:,16] / all_financeinfo.loc[:,4]) * 100
all_financeinfo.fillna('',inplace=True)
return render_template("index.html",code=code, all_financeinfo=all_financeinfo)
@app.errorhandler(404)
def not_found(error):
return make_response(jsonify({'error': 'Not found'}), 404)
if __name__ == '__main__':
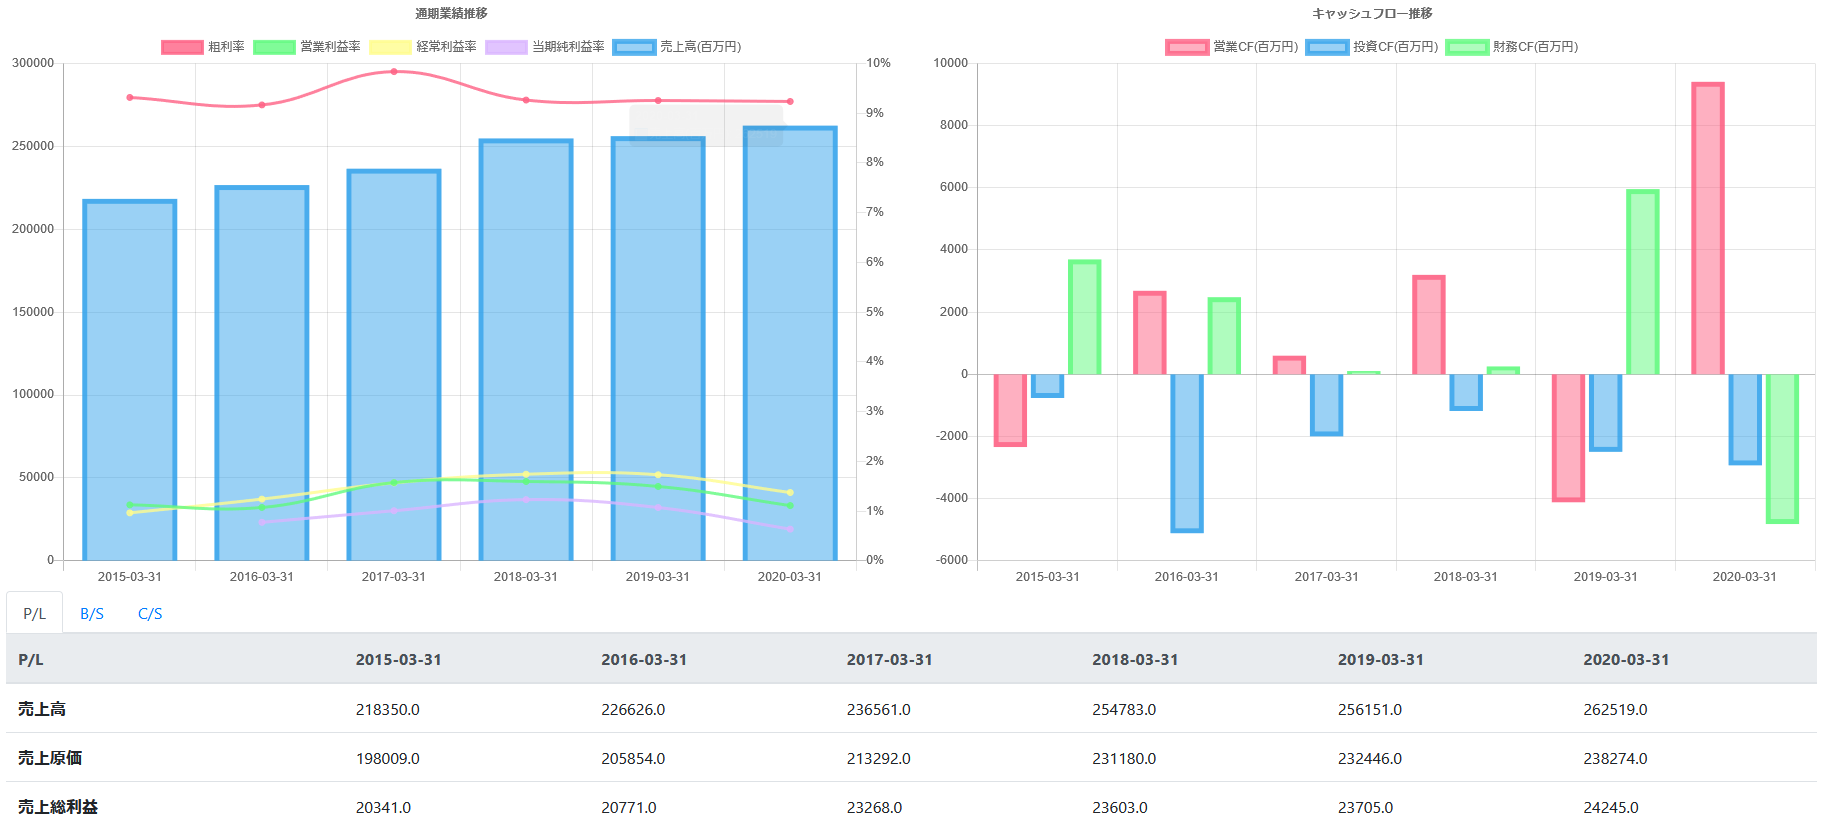
app.run(host='127.0.0.1', port=8080)チャート
チャートを表示するライブラリとして、今回はChart.jsを使用します。
証券会社のアプリで業績としてよくのっている情報をグラフとともに表示します。
以下、htmlファイル。
<!doctype html>
<html lang="ja">
<html>
  <head>
	<meta charset="utf-8">
    <meta name="viewport" content="width=device-width, initial-scale=1, maximum-scale=1">
    <link rel="stylesheet" href="https://stackpath.bootstrapcdn.com/bootstrap/4.2.1/css/bootstrap.min.css" integrity="sha384-GJzZqFGwb1QTTN6wy59ffF1BuGJpLSa9DkKMp0DgiMDm4iYMj70gZWKYbI706tWS" crossorigin="anonymous">
    <link rel="stylesheet" href="../static/css/bsadmin.css">
	<link rel="shortcut icon" href="../static/favicon.ico">
	<script src="https://cdnjs.cloudflare.com/ajax/libs/Chart.js/2.9.3/Chart.min.js"></script>
	<title>Financial Voice - {{code}}</title>
  </head>
  <body>

	 <div class="container-fluid">
	<div class="row">
      <div class="col-md-6">
        <canvas id="saleschart" width="600" height="400"></canvas>
      </div>
	  <div class="col-md-6">
        <canvas id="cashchart" width="600" height="400"></canvas>
      </div>
	</div>

	<ul class="nav nav-tabs">
      <li class="nav-item">
        <a class="nav-link active" id="item1-tab" data-toggle="tab" href="#item1" aria-controls="item1" aria-selected="true">P/L</a>
      </li>
      <li class="nav-item">
        <a class="nav-link" id="item2-tab" data-toggle="tab" href="#item2" aria-controls="item2" aria-selected="false">B/S</a>
      </li>
	  <li class="nav-item">
        <a class="nav-link" id="item3-tab" data-toggle="tab" href="#item3" aria-controls="item3" aria-selected="false">C/S</a>
      </li>
    </ul>

	<div class="tab-content">
    <div class="tab-pane fade show active" id="item1" aria-labelledby="item1-tab">

	<div class="row">
	  <div class="col-md-12">
        <table class="table">
		<thead class="thead-light">
		 <th class="fixed-column-0">P/L</th>
		 {% for enddate in all_financeinfo[3] %}
             <th>{{enddate}}</th>
         {% endfor %}
		</thead>
		<tbody>
		<tr>
			<th>売上高</th>
			{% for netsales in all_financeinfo[4] %}
			<td>{{netsales}}</td>
			{% endfor %}
		</tr>
		<tr>
			<th>売上原価</th>
			{% for costofsales in all_financeinfo[5] %}
			<td>{{costofsales}}</td>
			{% endfor %}
		</tr>
		<tr>
			<th>売上総利益</th>
			{% for grossprofit in all_financeinfo[6] %}
			<td>{{grossprofit}}</td>
			{% endfor %}
		</tr>
		<tr>
			<th>販管費</th>
			{% for sellinggeneral in all_financeinfo[7] %}
			<td>{{sellinggeneral}}</td>
			{% endfor %}
		</tr>
		<tr>
			<th>営業利益</th>
			{% for operatingincome in all_financeinfo[8] %}
			<td>{{operatingincome}}</td>
			{% endfor %}
		</tr>
		<tr>
			<th>営業外収益</th>
			{% for nonoperatingincome in all_financeinfo[9] %}
			<td>{{nonoperatingincome}}</td>
			{% endfor %}
		</tr>
		<tr>
			<th>営業外費用</th>
			{% for nonoperatingexpenses in all_financeinfo[10] %}
			<td>{{nonoperatingexpenses}}</td>
			{% endfor %}
		</tr>
		<tr>
			<th>経常利益</th>
			{% for ordinaryincome in all_financeinfo[11] %}
			<td>{{ordinaryincome}}</td>
			{% endfor %}
		</tr>
		<tr>
			<th>特別利益</th>
			{% for extraordinaryincome in all_financeinfo[12] %}
			<td>{{extraordinaryincome}}</td>
			{% endfor %}
		</tr>
		<tr>
			<th>特別損失</th>
			{% for extraordinaryloss in all_financeinfo[13] %}
			<td>{{extraordinaryloss}}</td>
			{% endfor %}
		</tr>
		<tr>
			<th>税引前当期純利益</th>
			{% for incomebeforeincometaxes in all_financeinfo[14] %}
			<td>{{incomebeforeincometaxes}}</td>
			{% endfor %}
		</tr>
		<tr>
			<th>法人税等</th>
			{% for incometaxes in all_financeinfo[15] %}
			<td>{{incometaxes}}</td>
			{% endfor %}
		</tr>
		<tr>
			<th>当期純利益</th>
			{% for profitloss in all_financeinfo[16] %}
			<td>{{profitloss}}</td>
			{% endfor %}
		</tr>
		</tbody>
		</table>
      </div>
	</div>
	</div>

    <div class="tab-pane fade" id="item2" aria-labelledby="item2-tab">
	<div class="row">
	  <div class="col-md-12">
        <table class="table">
		<thead class="thead-light">
		 <th class="fixed-column-0">P/L</th>
		 {% for enddate in all_financeinfo[3] %}
             <th>{{enddate}}</th>
         {% endfor %}
		</thead>
		<tbody>
		<tr>
			<th>流動資産</th>
			{% for currentassets in all_financeinfo[17] %}
			<td>{{currentassets}}</td>
			{% endfor %}
		</tr>
		<tr>
			<th>固定資産</th>
			{% for noncurrentassets in all_financeinfo[18] %}
			<td>{{noncurrentassets}}</td>
			{% endfor %}
		</tr>
		<tr>
			<th>有形固定資産</th>
			{% for propertyplantandequipment in all_financeinfo[19] %}
			<td>{{propertyplantandequipment}}</td>
			{% endfor %}
		</tr>
		<tr>
			<th>無形固定資産</th>
			{% for intangibleassets in all_financeinfo[20] %}
			<td>{{intangibleassets}}</td>
			{% endfor %}
		</tr>
		<tr>
			<th>投資その他の資産</th>
			{% for investmentsAndotherAssets in all_financeinfo[21] %}
			<td>{{investmentsAndotherAssets}}</td>
			{% endfor %}
		</tr>
		<tr>
			<th>流動負債</th>
			{% for currentliabilities in all_financeinfo[22] %}
			<td>{{currentliabilities}}</td>
			{% endfor %}
		</tr>
		<tr>
			<th>固定負債</th>
			{% for noncurrentliabilities in all_financeinfo[23] %}
			<td>{{noncurrentliabilities}}</td>
			{% endfor %}
		</tr>
		<tr>
			<th>純資産</th>
			{% for netAssets in all_financeinfo[24] %}
			<td>{{netAssets}}</td>
			{% endfor %}
		</tr>
		</tbody>
		</table>
      </div>
	</div>
	</div>

	<div class="tab-pane fade" id="item3" aria-labelledby="item3-tab">
	<div class="row">
	  <div class="col-md-12">
        <table class="table">
		<thead class="thead-light">
		 <th class="fixed-column-0">C/S</th>
		 {% for enddate in all_financeinfo[3] %}
             <th>{{enddate}}</th>
         {% endfor %}
		</thead>
		<tbody>
		<tr>
			<th>営業活動によるキャッシュ・フロー</th>
			{% for scf in all_financeinfo[25] %}
			<td>{{scf}}</td>
			{% endfor %}
		</tr>
		<tr>
			<th>投資活動によるキャッシュ・フロー</th>
			{% for icf in all_financeinfo[26] %}
			<td>{{icf}}</td>
			{% endfor %}
		</tr>
		<tr>
			<th>財務活動によるキャッシュ・フロー</th>
			{% for fcf in all_financeinfo[27] %}
			<td>{{fcf}}</td>
			{% endfor %}
		</tr>
		</tbody>
		</table>
      </div>
	</div>
	</div>

	</div>

</div> <!-- container -->

<script>
var barData = {
  labels : [{% for enddate in all_financeinfo[3] %}
            "{{enddate}}",
        {% endfor %}],
  datasets : [
  {
    type: 'line',
    label: '粗利率',
    borderColor : "rgba(254,97,132,0.8)",
    pointBackgroundColor    : "rgba(254,97,132,0.8)",
	fill: false,
	yAxisID: "y-axis-2",
    data : [{% for grossprofit in all_financeinfo[28] %}
			{%if grossprofit != 'nan' %}
                  {{grossprofit}},
			{% else %}
				,
			{% endif %}
           {% endfor %}]
  },
  {
    type: 'line',
    label: '営業利益率',
    borderColor : "rgba(96,250,126,0.8)",
    pointBackgroundColor    : "rgba(96,250,126,0.8)",
	fill: false,
	yAxisID: "y-axis-2",
    data : [{% for operatingincome in all_financeinfo[29] %}
			{%if operatingincome != 'nan' %}
				  {{operatingincome}},
			{% else %}
				,
			{% endif %}
           {% endfor %}]
  },
  {
    type: 'line',
    label: '経常利益率',
    borderColor : "rgba(255,252,141,0.8)",
    pointBackgroundColor    : "rgba(255,252,141,0.8)",
	fill: false,
	yAxisID: "y-axis-2",
    data : [{% for ordinaryincome in all_financeinfo[30] %}
			{%if ordinaryincome != 'nan' %}
                  {{ordinaryincome}},
			{% else %}
				,
			{% endif %}
           {% endfor %}]
  },
  {
    type: 'line',
    label: '当期純利益率',
    borderColor : "rgba(218,181,255,0.8)",
    pointBackgroundColor    : "rgba(218,181,255,0.8)",
	fill: false,
	yAxisID: "y-axis-2",
    data : [{% for profitloss in all_financeinfo[31] %}
			{%if profitloss != 'nan' %}
                  {{profitloss}},
			{% else %}
				,
			{% endif %}
           {% endfor %}]
  },
  {
    type: 'bar',
    label: '売上高(百万円)',
    borderColor : "rgba(54,164,235,0.8)",
    backgroundColor : "rgba(54,164,235,0.5)",
    borderWidth:5,
	yAxisID: "y-axis-1",
    data : [{% for netsales in all_financeinfo[4] %}
			{%if netsales != '-' %}
                  {{netsales}},
			{% else %}
				,
			{% endif %}
           {% endfor %}]
  }
  ]
}
var saleschart = document.getElementById("saleschart");
var schart = new Chart(saleschart, {
  type:'bar',
  data:barData,
  options: {
      responsive: true,
      title: {
        display: true,
        text: '通期業績推移'
      },
	  scales: {
        yAxes: [{
		  id: "y-axis-1",
		  type: "linear",
		  position: "left",
          ticks: {
            //suggestedMax: Math.max(values) / 1000000,
            suggestedMin: 0,
            //stepSize: 10,
            callback: function(value, index, values){
              return  value
            }
          }
        },
		{
		  id: "y-axis-2",
		  type: "linear",
		  position: "right",
          ticks: {
            //suggestedMax: Math.max(values) / 1000000,
            suggestedMin: 0,
            //stepSize: 10,
            callback: function(value, index, values){
              return  value + '%'
            }
          },
		  gridLines: {
			drawOnChartArea: false,
          }
        }
		]
      }
  }
});

var CashData = {
  labels : [{% for enddate in all_financeinfo[3] %}
            "{{enddate}}",
        {% endfor %}],
  datasets : [
  {
    type: 'bar',
    label: '営業CF(百万円)',
    borderColor : "rgba(254,97,132,0.8)",
    backgroundColor : "rgba(254,97,132,0.5)",
    borderWidth:5,
    data : [{% for scf in all_financeinfo[25] %}
			{%if scf != '-' %}
                  {{scf}},
			{% else %}
				,
			{% endif %}
           {% endfor %}]
  },
  {
    type: 'bar',
    label: '投資CF(百万円)',
    borderColor : "rgba(54,164,235,0.8)",
    backgroundColor : "rgba(54,164,235,0.5)",
    borderWidth:5,
    data : [{% for icf in all_financeinfo[26] %}
			{%if icf != '-' %}
                  {{icf}},
			{% else %}
				,
			{% endif %}
           {% endfor %}]
  },
  {
    type: 'bar',
    label: '財務CF(百万円)',
    borderColor : "rgba(96,250,126,0.8)",
    backgroundColor : "rgba(96,250,126,0.5)",
    borderWidth:5,
    data : [{% for fcf in all_financeinfo[27] %}
			{%if fcf != '-' %}
                  {{fcf}},
			{% else %}
				,
			{% endif %}
           {% endfor %}]
  }
  ]
}

var cashchart = document.getElementById("cashchart");
var cchart = new Chart(cashchart, {
  type:'bar',
  data:CashData,
  options: {
      responsive: true,
      title: {
        display: true,
        text: 'キャッシュフロー推移'
      },
	  scales: {
        yAxes: [{
          ticks: {
            //suggestedMax: Math.max(values) / 1000000,
            suggestedMin: 0,
            //stepSize: 10,
            callback: function(value, index, values){
              return  value
            }
          }
        }
		]
      }
  }
});
</script>
    <script src="https://code.jquery.com/jquery-3.3.1.slim.min.js" integrity="sha384-q8i/X+965DzO0rT7abK41JStQIAqVgRVzpbzo5smXKp4YfRvH+8abtTE1Pi6jizo" crossorigin="anonymous"></script>
    <script src="https://cdnjs.cloudflare.com/ajax/libs/popper.js/1.14.6/umd/popper.min.js" integrity="sha384-wHAiFfRlMFy6i5SRaxvfOCifBUQy1xHdJ/yoi7FRNXMRBu5WHdZYu1hA6ZOblgut" crossorigin="anonymous"></script>
    <script src="https://stackpath.bootstrapcdn.com/bootstrap/4.2.1/js/bootstrap.min.js" integrity="sha384-B0UglyR+jN6CkvvICOB2joaf5I4l3gm9GU6Hc1og6Ls7i6U/mkkaduKaBhlAXv9k" crossorigin="anonymous"></script>
  </body>
</html>
ということでtemplates配下にindex.htmlを配置し、下記でサーバを起動
python main.pyhttp://localhost:8080/company/1301にアクセスすると財務情報がグラフとともに確認できます。
(テストで銘柄コード1301を表示)
Cloud Storage
さてこの財務情報をGAEから取得し、表示するためにデータの永続化が必要になります。
そこで今回はGCPの無料枠の中で、Cloud Storageを使用してみます。
Cloud StorageはRDBではないですが、csvやjsonなどのファイルをIDで管理できます。
今回は先ほどと同じくcsv形式のファイルを保存します。
sample:
0,E00012,1301,2015-03-31,218350000000.0,198009000000.0,20341000000.0,17881000000.0,2460000000.0,674000000.0,1026000000.0,2107000000.0,3644000000.0,983000000.0,4769000000.0,2389000000.0,,69860000000.0,19076000000.0,12241000000.0,465000000.0,6369000000.0,46460000000.0,19406000000.0,23069000000.0,-2340000000.0,-762000000.0,3698000000.0
1,E00012,1301,2016-03-31,226626000000.0,205854000000.0,20771000000.0,18337000000.0,2433000000.0,698000000.0,317000000.0,2814000000.0,428000000.0,681000000.0,2561000000.0,804000000.0,1756000000.0,70426000000.0,24181000000.0,16972000000.0,907000000.0,6301000000.0,40835000000.0,30707000000.0,23065000000.0,2689000000.0,-5114000000.0,2482000000.0
2,E00012,1301,2017-03-31,236561000000.0,213292000000.0,23268000000.0,19544000000.0,3723000000.0,764000000.0,779000000.0,3709000000.0,651000000.0,458000000.0,3902000000.0,1518000000.0,2384000000.0,72351000000.0,25040000000.0,17137000000.0,496000000.0,7407000000.0,45195000000.0,26804000000.0,25391000000.0,601000000.0,-1998000000.0,105000000.0
有価証券報告書は事業年度ごとに更新されるので、頻繁に更新するわけではないことから、
今回はローカルから環境から下記コマンドで事前に銘柄コードごとに分けたcsvファイルをアップロードします。
マルチリージョンだと無料枠にひっかかるので、regionalを指定します。
gsutil mb -p プロジェクトID -l リージョン -c regional gs://バケット名GAEからCloud Storageのデータ取得
Cloud Storageへのデータの格納が終わったので、GAEからCloud Storageのデータ取得部分について実装します。
GCEのように特にAPI有効にせずとも、同じProject内であればデータを取得できます。
GAEからCloud Storageのデータを取得するため、下記モジュールをインストールしておきます。
pip3 install google-cloud-storage今回はバケット配下に、銘柄コードごとにcsvを配置したので、 下記のようにバケット名を指定し、csvデータをDL後ioモジュールを間に挟み、dataframeにデータを流しています。
from flask import Flask, render_template, jsonify, abort, make_response, request
from google.cloud import storage
from io import BytesIO
import pandas as pd

app = Flask(__name__)

@app.route('/company/<code>')
def get_finance(code):
    # for GCP
    storage_client = storage.Client()
    bucket = storage_client.get_bucket(バケット名)
    csv=str(code)+'.csv'
    blob = bucket.get_blob(csv)
    all_financeinfo = pd.read_csv(BytesIO(blob.download_as_string()),header=None)

    all_financeinfo.loc[:,4:27] /= 1000000
    all_financeinfo.loc[:,28] = (all_financeinfo.loc[:,6] / all_financeinfo.loc[:,4]) * 100
    all_financeinfo.loc[:,29] = (all_financeinfo.loc[:,8] / all_financeinfo.loc[:,4]) * 100
    all_financeinfo.loc[:,30] = (all_financeinfo.loc[:,11] / all_financeinfo.loc[:,4]) * 100
    all_financeinfo.loc[:,31] = (all_financeinfo.loc[:,16] / all_financeinfo.loc[:,4]) * 100
    all_financeinfo.fillna('',inplace=True)

    return render_template("index.html",code=code, all_financeinfo=all_financeinfo)

@app.errorhandler(404)
def not_found(error):
    return make_response(jsonify({'error': 'Not found'}), 404)

if __name__ == '__main__':
    app.run(host='127.0.0.1', port=8080)
最後に一言
Cloud StorageはDataStoreと異なり、無料枠で5GBのストレージ制限と容量が大きく、取り出しも簡単なので、 とりあえず投げておくというスタンスでも使用できそうです。